

Your monthly marketing report runs pages of traffic, impressions and opens, yet the team still asks: where is the pipeline? Most dashboards track activity that never maps to revenue. This guide sorts common B2B marketing metrics into two groups: the KPIs that predict pipeline and the vanity metrics that should not lead a board report.
At Intelligent Resourcing, we use one test for every marketing metric: would a change in this number lead to a different decision next week?
What Separates a Pipeline-Predictive KPI From a Vanity Metric
A KPI is a metric that changes a decision; a vanity metric only makes the report look busy. If moving a metric would not change what your team does next week, it does not belong on the board deck.
The Metric-Versus-KPI Distinction
Traffic, impressions and email opens are useful activity metrics, but they only become KPIs when a change in the number triggers a clear action. A rise in website traffic may show greater visibility, but it does not prove commercial impact. Lead-to-customer conversion is a stronger KPI because it connects marketing activity to revenue and helps teams decide when targeting, qualification or follow-up needs to change.
The Three-Question Test for Any Metric
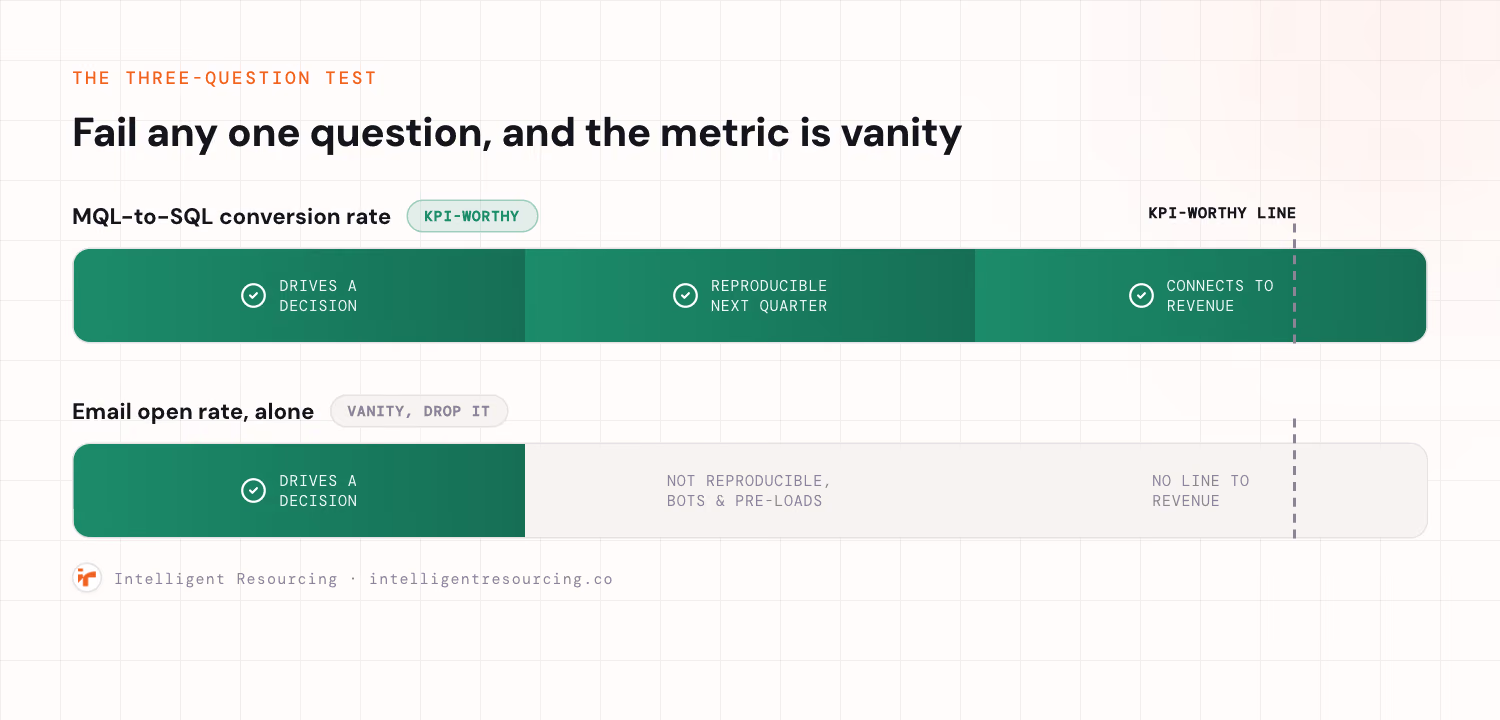
Run every candidate metric through three questions before it earns a dashboard slot:
- Does it drive a decision? If it moves, does anyone act differently?
- Can you reproduce it? Would the same input give the same number next quarter?
- Does it connect to revenue? Can you trace a line from the metric to money?
ZoomInfo's 2026 guidance runs a similar test: a metric that drives no decision, cannot be reproduced, and never connects to pipeline or revenue is vanity.
| Activity Metric | Decision-Linked KPI |
|---|---|
| Page views | Conversion rate by source |
| Email opens | Reply rate and meetings booked |
| Social followers | Engagement from target accounts |
| Total lead volume | MQL-to-SQL conversion rate |
Activity metrics can rise while the pipeline remains flat. Decision-linked KPIs are more useful because a change in the number prompts action. The fastest way to clean up your dashboard is to test every metric against three questions: does it guide a decision, can it be measured consistently, and does it connect to pipeline or revenue? Remove any metric that fails all three.
Leading Indicators vs Lagging Indicators in B2B Marketing
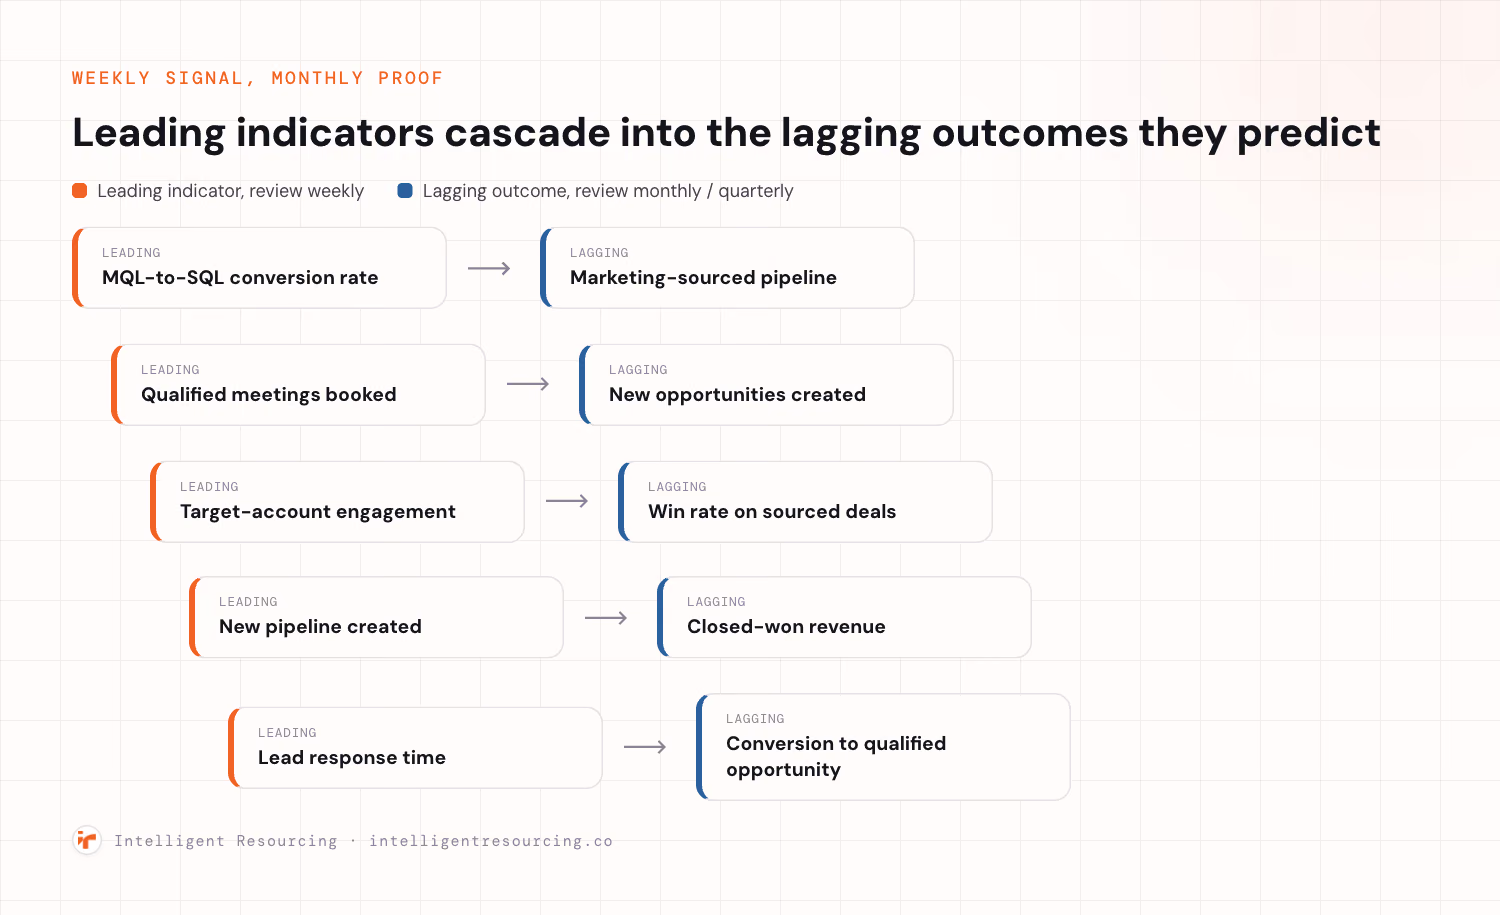
Leading indicators are early, controllable signals that predict tomorrow's pipeline. Lagging indicators are closed outcomes you can no longer influence. A dashboard of only lagging metrics reports the result after the quarter is already decided.
What Leading Indicators Look Like in Marketing
The early signals worth reviewing weekly are MQL-to-SQL conversion, target-account engagement, qualified meetings booked, and new pipeline created. These are the levers a team can still pull this quarter. Teams running signal-led sales motions watch them weekly, because a leading indicator only helps while there is still time to act.
What Lagging Indicators Confirm (But Arrive Too Late to Fix)
Closed-won revenue, blended win rate and CAC payback confirm whether the strategy delivered results. Review them monthly or quarterly, because they cannot be changed once the underlying activity has already happened. The further downstream a metric sits, the less frequently it needs reviewing, as its inputs were often determined weeks or months earlier.
| Leading Indicator (Review Weekly) | Lagging Outcome It Predicts (Review Monthly or Quarterly) |
|---|---|
| MQL-to-SQL conversion rate | Marketing-sourced pipeline |
| Qualified meetings booked | New opportunities created |
| Target-account engagement | Win rate on sourced deals |
| New pipeline created | Closed-won revenue |
| Lead response time | Conversion to qualified opportunity |
Read left to right and you have a forecast: this week's leading numbers become next quarter's lagging results. A team watching the left column can correct course, while one reporting only the right can explain a miss but never prevent it.
Which B2B Marketing KPIs Predict Pipeline?
The six B2B marketing KPIs that best predict pipeline are marketing-sourced pipeline, pipeline contribution, MQL-to-SQL conversion, cost per SQL, win rate on sourced deals and pipeline velocity. Together, they show whether marketing is creating qualified demand, converting it efficiently and moving it towards revenue.
Each KPI below states what it measures, what it predicts, and how to calculate it. Where measurement is signal-led, these double as pipeline metrics for signal marketing.
| KPI | What It Measures | What It Predicts | Formula |
|---|---|---|---|
| Marketing-sourced pipeline | Pipeline from marketing-originated deals | Near-term revenue marketing can claim | Opportunity value where source is marketing |
| Pipeline contribution % | Marketing's share of pipeline | Marketing's influence on the number | Marketing-influenced pipeline / total pipeline |
| MQL-to-SQL conversion | Lead quality, not volume | Whether volume becomes opportunities | SQLs / MQLs |
| Cost per SQL | Efficiency of qualified demand | Whether spend scales profitably | Marketing spend / SQLs |
| Win rate on sourced deals | Quality of sourced pipeline | Revenue that actually closes | Won deals / sourced deals |
| Pipeline velocity | Speed pipeline converts to revenue | How fast this quarter's pipeline lands | (Opportunities x win rate x deal size) / cycle length |
What Evidence Connects These KPIs to Pipeline Growth?
Pipeline-predictive KPIs become more useful when they are segmented by source, buying signal, customer type and campaign rather than reported as blended averages. This reveals which activities create qualified opportunities and which only generate volume.
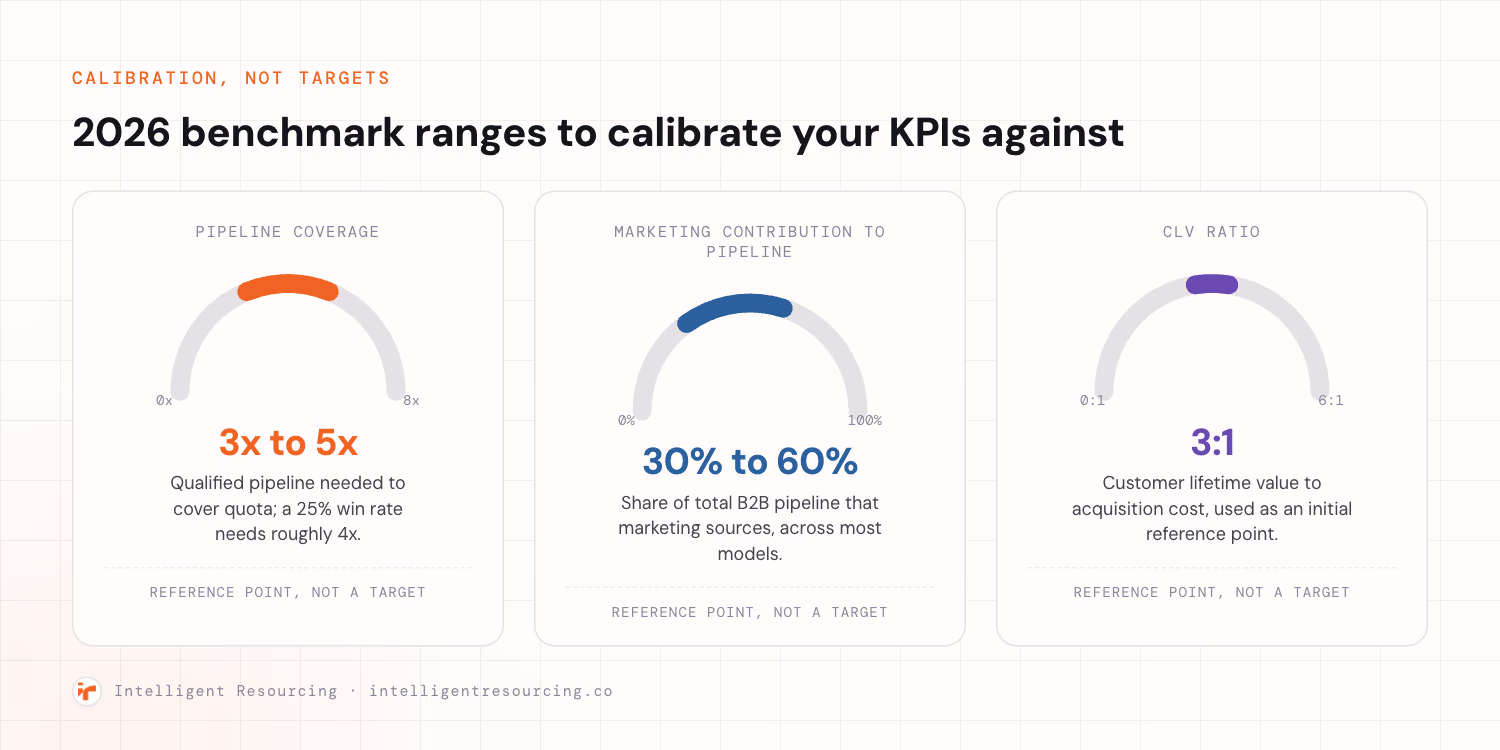
Abacum's 2025 analysis suggests that marketing commonly contributes between 30% and 60% of total B2B pipeline and presents a CLV ratio of 3:1 as a useful reference point. These figures should be treated as calibration ranges, not universal targets, because deal value, sales motion and attribution rules vary by business.
Salesmotion's 2026 analysis also supports splitting win rate by the trigger that started the opportunity. This helps teams identify whether events such as hiring growth, funding, technology changes or high-intent website activity produce pipeline with a greater probability of closing.
The practical lesson is to avoid reporting one blended conversion or win rate. Compare performance by source and signal so budget follows the activity that creates the strongest opportunities.
Which B2B Marketing Vanity Metrics Should You Drop?
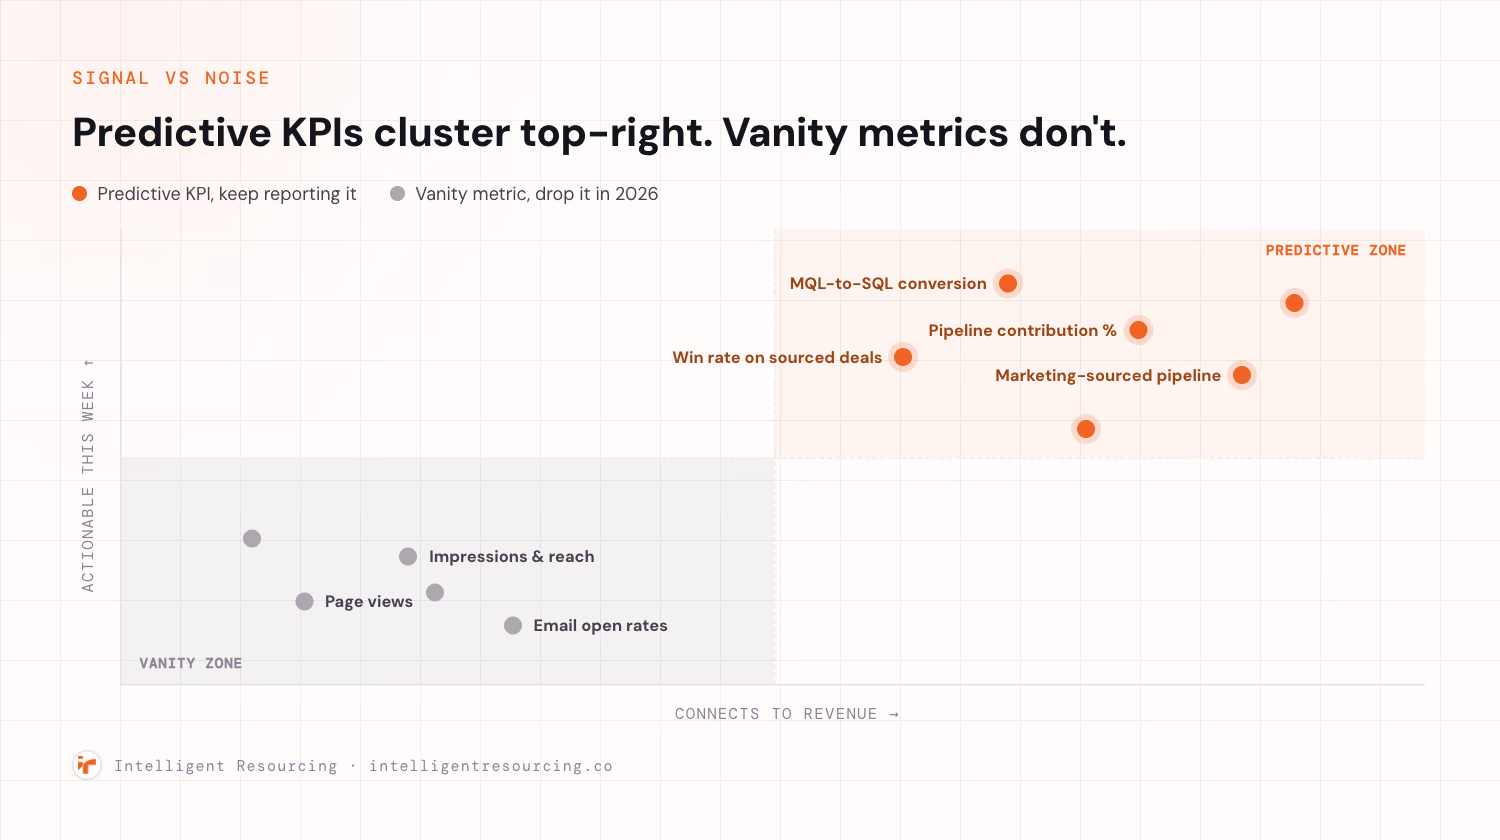
Page views, impressions, social followers, email open rates and raw lead volume should not lead a B2B board report. These metrics can help diagnose campaign activity, but they do not prove that marketing is creating qualified demand or pipeline.
| Activity Metric | Why It Can Mislead | Measure This Instead | Decision It Supports |
|---|---|---|---|
| Page views | Includes visitors with no commercial relevance | Conversion rate by source | Which traffic sources create qualified demand |
| Impressions and reach | Rewards exposure without showing account quality | Engagement from target accounts | Whether campaigns are reaching the right organisations |
| Social followers | Measures audience size rather than buying intent | Referral pipeline from social | Whether social activity contributes to opportunities |
| Email open rates | Can be distorted by bots and privacy features | Reply rate and meetings booked | Whether the message generates meaningful action |
| Raw MQL volume | Hides poor fit and weak qualification | MQL-to-SQL conversion rate | Whether targeting and scoring produce sales-ready demand |
Reach and activity metrics are not automatically useless. They can support brand measurement, channel testing and campaign diagnosis. They should not, however, be presented as commercial success metrics unless they have a measurable connection to qualified demand, opportunity creation or revenue.
How Do You Build a Pipeline-Predictive KPI Dashboard?
Build the dashboard backwards from the revenue target, then include only the KPIs that explain whether enough qualified pipeline is being created, progressed and converted. Keep the executive view to five to seven measures so changes remain visible and actionable.
- Start with the revenue target: Calculate how much pipeline is required based on historical win rate, average deal value and sales-cycle length.
- Choose five to seven KPIs: Include a balanced mix of leading indicators, pipeline measures and closed outcomes.
- Set decision thresholds: Define the range that represents healthy performance and the action required when a KPI moves outside it.
- Assign one owner: Give each KPI to a named person who is responsible for investigating changes and coordinating the response.
- Match the review cadence: Review fast-moving indicators weekly, pipeline progression monthly and revenue economics quarterly.
At Intelligent Resourcing, we build dashboards around thresholds and responses rather than decorative reporting. Every KPI should have a clear definition, a named owner and an agreed action when performance changes.
Choose Five to Seven KPIs
A focused dashboard makes deviations easier to detect. A fall in conversion or pipeline velocity is visible immediately on a short scorecard, while the same change can disappear among dozens of activity metrics.
Supporting diagnostic metrics can remain available in channel reports. They do not all need to appear in the executive dashboard.
Assign an Owner and a Review Cadence
Every KPI needs one named owner, because a metric owned by everyone is watched by no one. Pair ownership with cadence: leading indicators weekly, lagging indicators monthly or quarterly. A documented lead scoring model keeps the definition of a qualified lead stable, so the owner measures the same thing each week.
B2B Marketing KPI Benchmarks to Calibrate Against in 2026
Use your own historical performance as the primary benchmark and external ranges as secondary reference points. A benchmark is useful only when it reflects your deal value, sales cycle, market and attribution model.
| KPI | Starting Reference Point | How to Apply It | Evidence Base |
|---|---|---|---|
| Lead response time | Route and respond as quickly as operationally possible | Track median response time and the 90th percentile rather than relying only on an average | Chili Piper customer benchmark data |
| Pipeline coverage | Calculate from historical win rate; 3x to 5x may be used as an initial planning reference | A 25% win rate generally requires roughly 4x qualified pipeline to support the target | Internal CRM data should be primary |
| MQL-to-SQL conversion | Compare against your trailing-quarter baseline | Segment by source, campaign, ICP fit and account tier | Your own marketing and CRM data |
| Marketing contribution to pipeline | 30% to 60% as an external reference range | Separate marketing-sourced from marketing-influenced pipeline | Abacum analysis |
| Win rate | Compare by trigger, source, segment and deal type | Avoid relying on one blended company-wide rate | Salesmotion analysis and CRM data |
| CLV ratio | 3:1 as an initial reference, not a universal target | Interpret alongside gross margin, retention and CAC payback | Abacum analysis and finance data |
Chili Piper's February 2025 customer benchmark, based on nearly four million form submissions, found that immediate meeting booking increased inbound conversion from approximately 30% to 66.7%. This does not establish a universal five-minute response rule, but it supports reducing the delay between high-intent action and sales engagement.
Set Your Baseline Before Chasing an Industry Average
Industry averages can be misleading because conversion rates vary by market, deal size, qualification standards and sales motion. Businesses with fewer than four quarters of reliable data should begin with a trailing-quarter baseline and improve it consistently.
Use external benchmarks to identify questions, not to dictate targets. Your historical conversion, velocity and win-rate data provide the most defensible standard for planning and board reporting.
Set Up Your KPI Set That Connects Marketing to Revenue
A credible B2B marketing dashboard shows whether qualified demand is becoming a pipeline and whether that pipeline is progressing towards revenue. It does not need more metrics. It needs clearer definitions, stronger ownership and an agreed decision attached to every number.
Audit the current dashboard and remove any metric that does not guide a repeatable, revenue-linked action. Keep activity data in supporting reports, but lead the executive view with conversion, qualified opportunities, pipeline velocity, win rate and revenue contribution.
If your board report still leads with traffic, impressions and email opens, get in touch with Intelligent Resourcing to rebuild it around the measures that predict commercial progress. The result is a shorter scorecard in which every KPI has an owner, a threshold and a decision attached to it.
Buyer Intent
Intelligent Resourcing audits your current dashboard, drops the metrics that do not predict revenue, and rebuilds it around KPIs with a named owner, a threshold and an agreed decision.
FAQs
Which KPI Is Most Likely to Be a Vanity Metric?
Email open rate and raw follower or list-size counts are the usual offenders. Each can double next quarter without a single extra dollar of pipeline, which is the clearest sign of vanity. Open rates are also distorted by bots and image pre-loading, so the number climbs while real engagement falls.
What Are the Most Important B2B Marketing KPIs That Predict Pipeline?
The short list is marketing-sourced and influenced pipeline, pipeline contribution percentage, MQL-to-SQL conversion rate, cost per SQL, and win rate on sourced deals. These predict rather than describe, because each traces a direct line to future revenue rather than counting activity that already happened.
What Is the Difference Between Leading and Lagging Indicators in B2B Marketing?
Leading indicators predict future pipeline and can still be influenced this quarter; qualified meetings booked is one, because you can act on a dip immediately. Lagging indicators confirm results after the fact; closed-won revenue is one, because the deals are already decided. A useful dashboard carries both.
How Many B2B Marketing KPIs Should You Actually Track?
Five to seven, balanced across funnel stages. A focused set in this range makes deviations visible fast, and a thirtieth metric adds no insight; it dilutes attention and slows the time between a deviation and a decision.
What Is a Good Pipeline Coverage Ratio?
A commonly used planning range is roughly three to five times quota, though the right ratio depends on your win rate and deal cycle. Too little coverage leaves no room to absorb normal slippage, so you miss the number. Too much is usually a sign of stale opportunities that never close. Weight it by stage, because early-stage pipeline converts lower than late-stage.