

What Metrics Actually Prove B2B Lead Generation ROI?
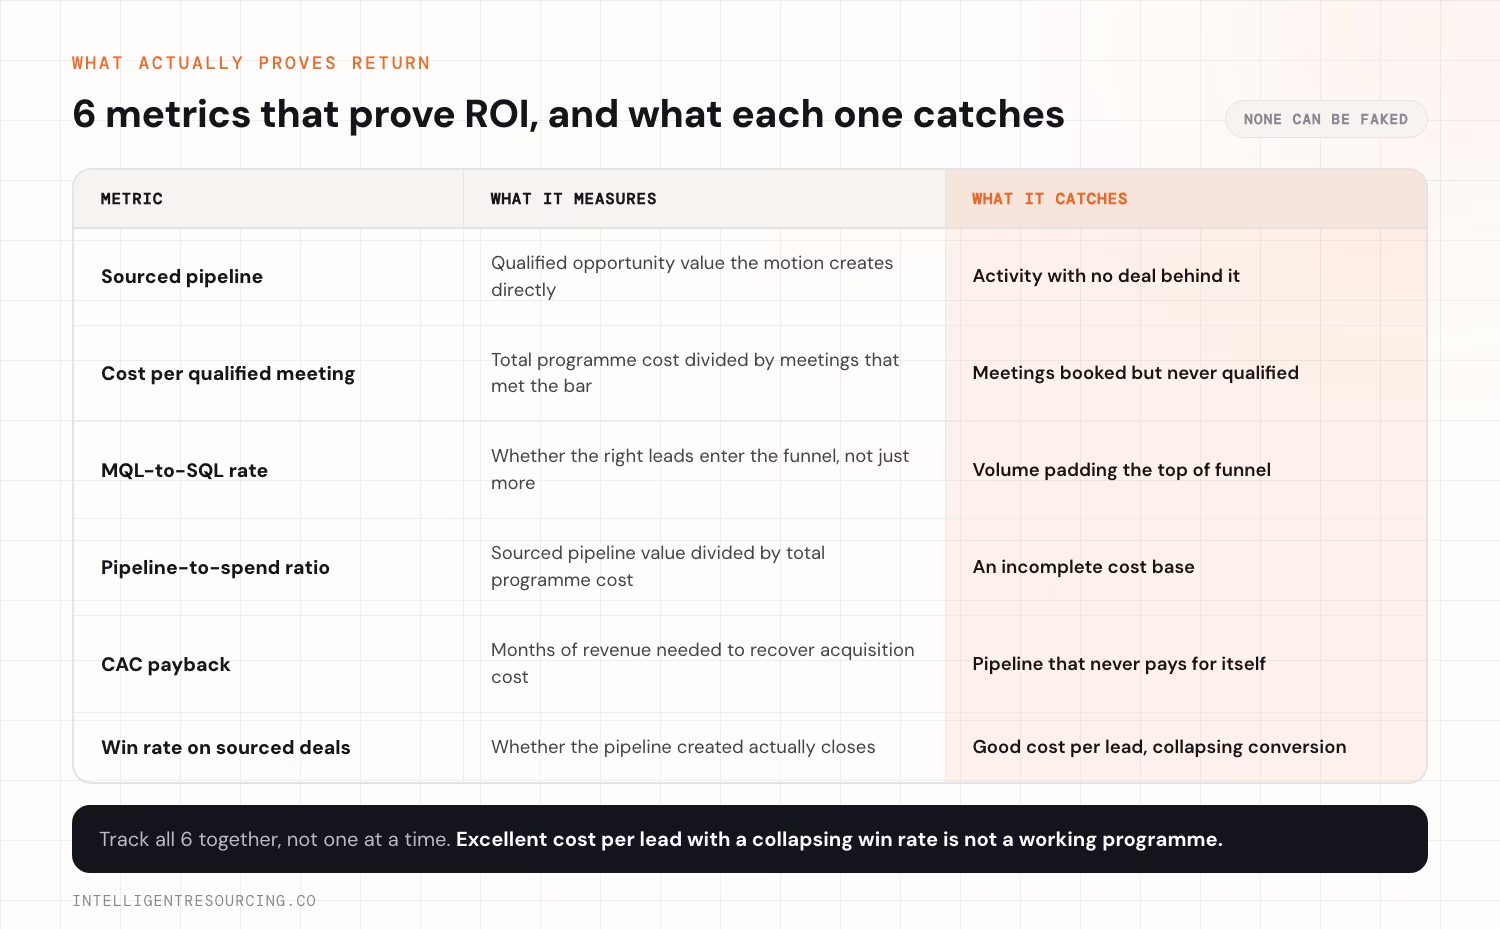
Six metrics prove return: sourced pipeline, cost per qualified meeting, marketing-qualified-lead-to-sales-qualified-lead (MQL-to-SQL) rate, pipeline-to-spend ratio, CAC payback, and win rate on sourced deals. Lead volume and cost per lead only describe activity. None of the six can be faked by adding more low-quality leads to the funnel. That is why they matter more.
Cost per lead is the most reported number in B2B lead generation. It is also the least useful on its own. HubSpot research puts the average B2B cost per lead across all channels at 84 USD, but the industry spread runs from 91 USD in ecommerce to 653 USD in financial services. A single average hides a 7x range.
Consider two leads. One costs 400 USD and converts at 15%, so each customer costs about 2,667 USD. One costs 80 USD and converts at 1%, so each customer costs 8,000 USD. The expensive lead is three times cheaper per customer. Cost per lead alone cannot show you which is which.
The six metrics break down like this:
- Sourced pipeline: the qualified opportunity value the motion creates directly. Tracked as a named deal with a stage, an amount and a close date.
- Cost per qualified meeting: total programme cost divided by meetings that met the qualification bar.
- MQL-to-SQL rate: shows whether the right leads are entering the funnel, not just more leads.
- Pipeline-to-spend ratio: sourced pipeline value divided by total programme cost. The number most chief financial officers (CFOs) ask for first.
- CAC payback: how many months of revenue it takes to recover the acquisition cost.
- Win rate on sourced deals: confirms the pipeline created is pipeline that actually closes.
Sourced pipeline is not influenced pipeline, and the two get confused constantly. As Dreamdata sets out, influenced pipeline is always the larger number, because it counts every deal that received any marketing touch on top of the deals marketing actually originated. Reporting the bigger number as sourced pipeline is the fastest way to lose finance's trust.
Track all six together, not one at a time. A programme with excellent cost per lead and a collapsing win rate is not working, whatever the first number says.
How Do You Calculate Cost Per Qualified Meeting?
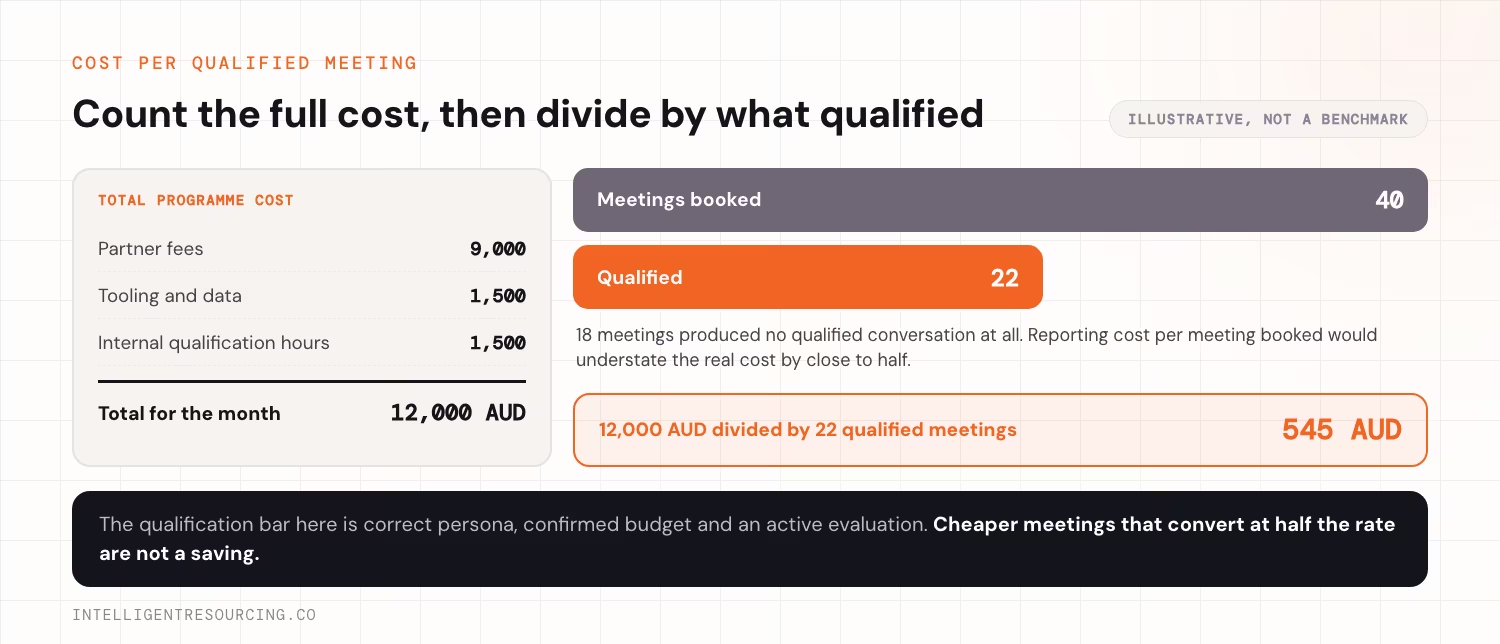
Cost per qualified meeting equals total programme cost divided by the number of meetings that met your qualification bar. Not the number booked. Total programme cost has three parts: the retainer or ad spend, tooling and data costs, and internal hours spent qualifying and running the meeting.
Cost per qualified meeting = total programme cost divided by qualified meetings held.
Take an illustrative case. A programme costs 12,000 AUD in a month: 9,000 AUD in partner fees, 1,500 AUD in tooling and data, and 1,500 AUD in internal qualification time. That month produces 40 meetings booked, but only 22 meet the qualification bar of correct persona, confirmed budget and an active evaluation. Cost per qualified meeting is 12,000 divided by 22, or 545 AUD.
| Input | Illustrative amount | What it measures |
|---|---|---|
| Total programme cost | 12,000 AUD | Partner fee, tooling, data, internal qualification hours |
| Meetings booked | 40 | Every meeting placed on a calendar |
| Qualified meetings held | 22 | Meetings that met the qualification bar |
| Cost per qualified meeting | 545 AUD | Total cost divided by qualified meetings |
The figure is illustrative, not a benchmark. It shows the gap between meetings booked and meetings that matter. Here, 18 of the 40 meetings produced no qualified conversation at all. A report using cost per meeting booked would understate the real cost by close to half.
CAC payback closes the loop on this number. The 2026 Aleph and Benchmarkit SaaS benchmarks, drawn from 342 software companies with 198 reporting this metric, put median software-as-a-service (SaaS) CAC payback at 16 months. Top-quartile teams recover the cost in 6 months or fewer. The bottom quartile takes 24 months or more.
Cost per qualified meeting tells you what a conversation costs. CAC payback tells you how long that conversation takes to pay for itself.
Cheaper meetings that convert at half the rate are not a saving. See how signal-led prospecting cuts qualification cost before the meeting is booked, in the signal-led prospecting guide.
What Is a Good B2B Lead Generation ROI Benchmark in 2026?
There is no single good ROI figure for B2B lead generation in 2026. The right number depends on funding stage, motion maturity, and how strictly you define sourced pipeline. What can be measured is the direction. Sales cycles are getting longer, so a 2024 benchmark already understates today's payback window.
Salesforce's State of Sales research found 57% of sales professionals say their sales cycle is getting longer, and that reps spend only 40% of their time actively selling. The rest goes to admin and internal coordination. A motion that assumes a 2025 close rate on a 2026 sales cycle will report a worse ROI than it actually delivered, because the measurement window closed too early.
Treat a benchmark as a starting range, not a target. Where a business lands depends more on funding stage and motion maturity than on the channel it chose.
| Funding stage | Payback speed | Return profile |
|---|---|---|
| Seed and early-stage | Faster, off a smaller revenue base | Smaller absolute return |
| Series A and B | Slower, over a longer cycle | Larger absolute return |
A workable range across stages is 3 to 8 times total programme cost within 12 months for a mature, signal-based motion.
How you get that range matters more than the number itself. Intelligent Resourcing's GTM Engineering track is built on sourced pipeline and CAC payback from day 1. That gives a motion real numbers to benchmark against by month 3, not just activity data.
The instructive point is not the number. It is the trend. As the sales cycle extends, the attribution window used to calculate ROI has to extend with it. Otherwise the reported return will look worse than the pipeline actually is.
Why Do Most B2B Teams Miscalculate Lead Gen ROI?
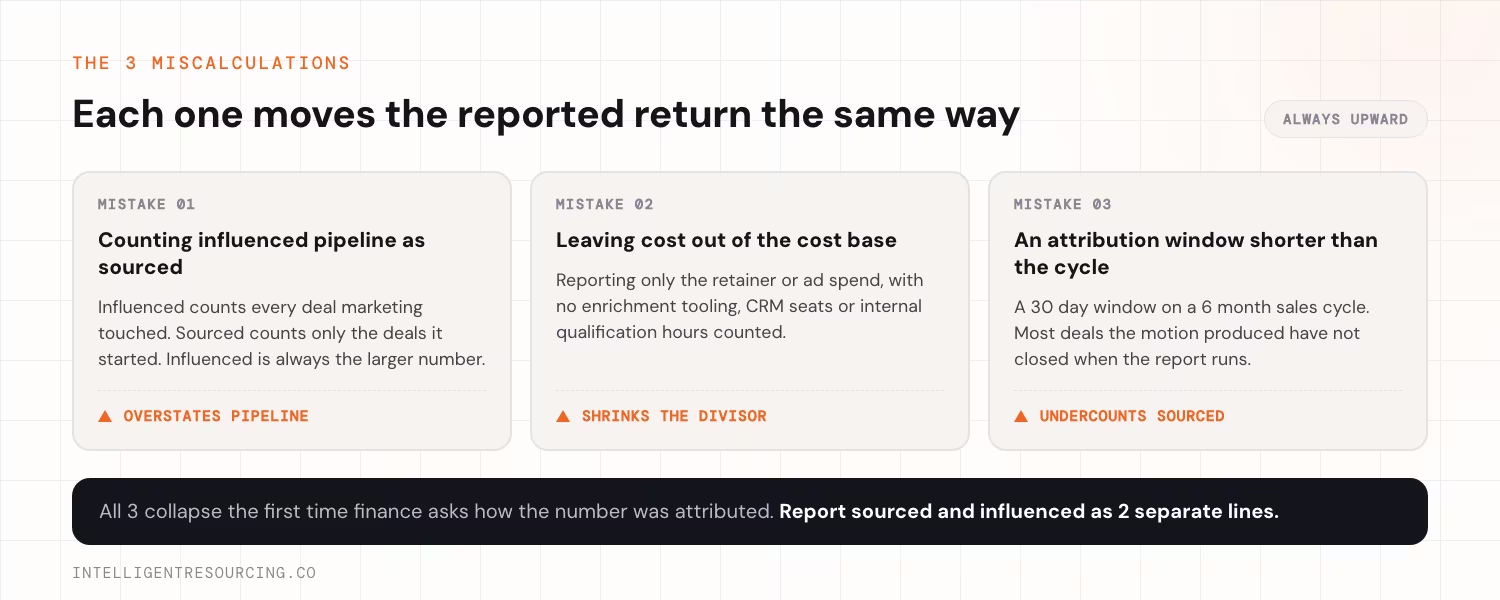
Most B2B teams miscalculate lead generation ROI in 3 ways. Each one moves the reported return in the same direction: upward, away from what the CFO will actually find. The underlying problem is usually plumbing, not intent: Knecht Strategies reported in 2026 that nearly 90% of B2B teams struggle with attribution because siloed systems track different slices of the buyer journey.
Counting influenced pipeline as sourced. Influenced pipeline runs several times larger than sourced, because it includes every deal marketing touched rather than the deals it started. Reporting the bigger number as if it were sourced is the most common way an ROI figure gets overstated. The 2026 Demand Gen Benchmark Survey now asks teams to report sourced revenue and influenced pipeline as separate lines, which is a fair signal of where the standard is heading.
Leaving cost out of the cost base. A programme often reports only its retainer or ad spend. It leaves out enrichment tooling, customer relationship management (CRM) seats, and the internal hours spent qualifying meetings. That means dividing pipeline by a number that is too small. The resulting ROI figure looks stronger than it is, and it collapses the first time finance asks for the full cost.
Using an attribution window shorter than the sales cycle. A 30-day window on a 6-month sales cycle will always undercount sourced pipeline. Most deals that motion produced have not closed yet when the report runs.
Different delivery models carry very different cost bases before ROI even enters the picture. The lead generation pricing guide sets out what each model actually costs.
How Do You Build a Reporting Cadence Sales Actually Trusts?
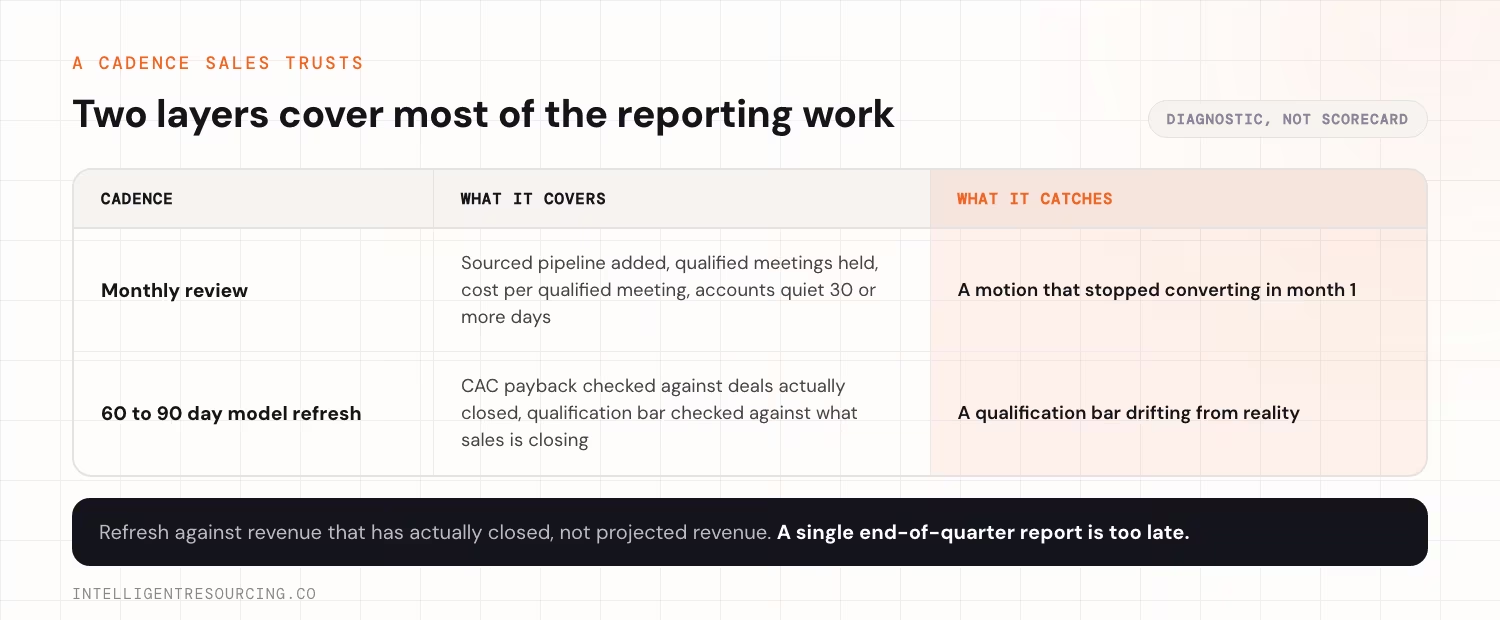
A reporting cadence sales trusts reviews sourced pipeline and cost per qualified meeting every month. It refreshes the full ROI model every 60 to 90 days against actual closed revenue, not projected revenue. A single end-of-quarter report cannot catch a motion that quietly stopped converting in month 1.
Two layers cover most of the work.
| Cadence | What it covers |
|---|---|
| Monthly review | Sourced pipeline added, qualified meetings held, cost per qualified meeting, any account gone quiet for 30 or more days |
| 60 to 90 day model refresh | CAC payback checked against deals actually closed, qualification bar checked against what sales is closing |
The 60 to 90 day refresh is where the real work happens. It checks whether a qualified meeting still matches what sales is actually closing, not just what marketing is counting.
Where teams get this wrong is treating pipeline reporting as a pass-or-fail scorecard rather than a diagnostic. Pipeline coverage is the clearest example. Most B2B teams target a coverage ratio between 3x and 5x, but the required number is the inverse of your win rate. A team closing 20% of opportunities needs 5x, not the generic 3x. Applying the generic multiple tells you nothing about whether the pipeline is healthy.
The link back to the wider signal-led model matters here. A motion built on a Verified Buying Window already tracks which signal opened the account, and when. The sourced-pipeline data this system depends on is captured at first contact, not rebuilt from a CRM 3 months later.
Reporting only works if the underlying pipeline is signal-led from the start. The Intelligent Prospecting Playbook sets out the full system this framework sits on top of.
For the partner-level version of this question, comparing a GTM partner's return against a build-in-house model, see the GTM partner ROI guide.
Lead Generation
Cost per lead is the number every dashboard already shows. Sourced pipeline, cost per qualified meeting and CAC payback are the numbers that survive a board conversation. Build the cadence once, apply it monthly, and refresh the model every 60 to 90 days against revenue that has actually closed.
FAQs
What is a good ROI for B2B lead generation?
A workable range is 3 to 8 times total programme cost within 12 months for a mature, signal-based motion. The right figure depends on funding stage and motion maturity. Seed-stage companies see faster payback on a smaller pipeline base, while later-stage companies post a larger absolute return over a longer cycle.
How do you calculate cost per qualified meeting?
Divide total programme cost, including partner fees, tooling and internal qualification hours, by the number of meetings that met your qualification bar. Not the number booked. A programme using cost per meeting booked instead will understate its real cost, often by close to half.
What is the difference between sourced and influenced pipeline?
Sourced pipeline is the opportunity value the motion directly created. Influenced pipeline is existing opportunity value the motion touched but did not originate. Influenced is always the larger number, because it counts every deal that received any marketing touch, so reporting the two as one figure inflates the apparent return.
How often should you review lead generation ROI?
Review sourced pipeline and cost per qualified meeting monthly, and refresh the full ROI model every 60 to 90 days against revenue that has actually closed. A single end-of-quarter report is too infrequent to catch a motion that has stopped converting.
What is the most common mistake in lead gen ROI reporting?
Counting influenced pipeline as sourced pipeline. It is the single change that most inflates a reported return. Influenced pipeline is several times larger than sourced, and finance teams will discount the figure the moment they ask how it was attributed.