


The ABM KPIs that matter fall into four tiers: account coverage, account engagement, pipeline progression, and revenue and retention. They should be measured in that order because each stage feeds the next. A metric only belongs on the dashboard when a change in the number would change what the team does next.
Traditional lead-generation metrics such as MQL volume, form fills and cost per lead measure individuals rather than accounts. This creates a reporting gap where activity rises, but leadership still cannot see whether target accounts are moving towards pipeline or revenue.
Intelligent Resourcing builds account-level measurement frameworks for B2B teams running signal-led ABM. This guide explains which KPIs hold up in a board review, which vanity metrics to remove and how often each tier should be reviewed.
Why Traditional Marketing KPIs Fail for Account-Based Marketing
ABM is won or lost at the account and buying-group level, which means lead-count, MQL-volume and cost-per-lead metrics measure the wrong unit and reward reach over relevance. This is a category error, not a tooling problem. A rising MQL count can hide a shrinking set of engaged target accounts, so you report a strong month while your buying groups go quiet. Moving to the account-level view at the heart of account-based GTM is what makes the numbers describe reality again.
Person-Based Metrics Miss the Buying Group
MQLs score individuals, but ABM deals are decided by committees, so a single hand-raiser is a weak signal when several other stakeholders are silent. Treating one contact as qualified overstates readiness and sends sales in early. The scale of the problem is structural: most B2B sellers now sell to buying groups rather than single contacts, so a single-contact metric was never built to reflect how these deals actually get decided.
Side by Side: Traditional KPI vs ABM KPI
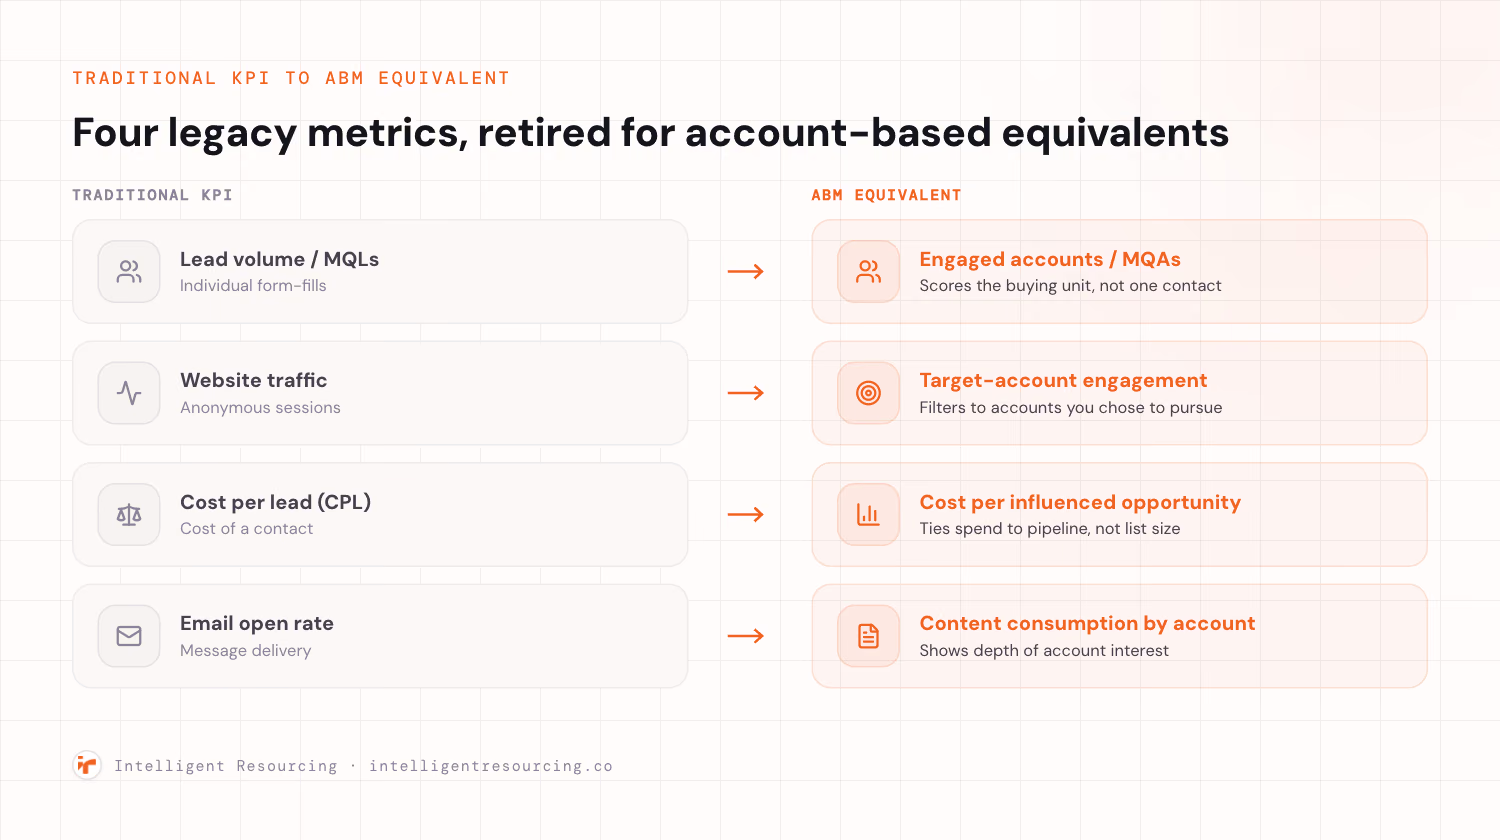
Here is how the common lead-generation metrics map to their account-based equivalents.
| Traditional marketing KPI | What it measures | ABM equivalent | Why the ABM version is better |
|---|---|---|---|
| Lead volume / MQLs | Individual form-fills | Engaged accounts (MQAs) | Scores the buying unit, not one contact |
| Website traffic | Anonymous sessions | Target-account engagement | Filters to accounts you chose to pursue |
| Cost per lead (CPL) | Cost of a contact | Cost per influenced opportunity | Ties spend to pipeline, not list size |
| Email open rate | Message delivery | Content consumption by account | Shows depth of account interest |
Every ABM equivalent describes an account, not a person, so the report answers what leadership actually asks: are the accounts we chose moving towards a decision? Report the right-hand column and the "engagement up, revenue flat" gap closes.
The ABM KPIs: A Four-Tier Framework
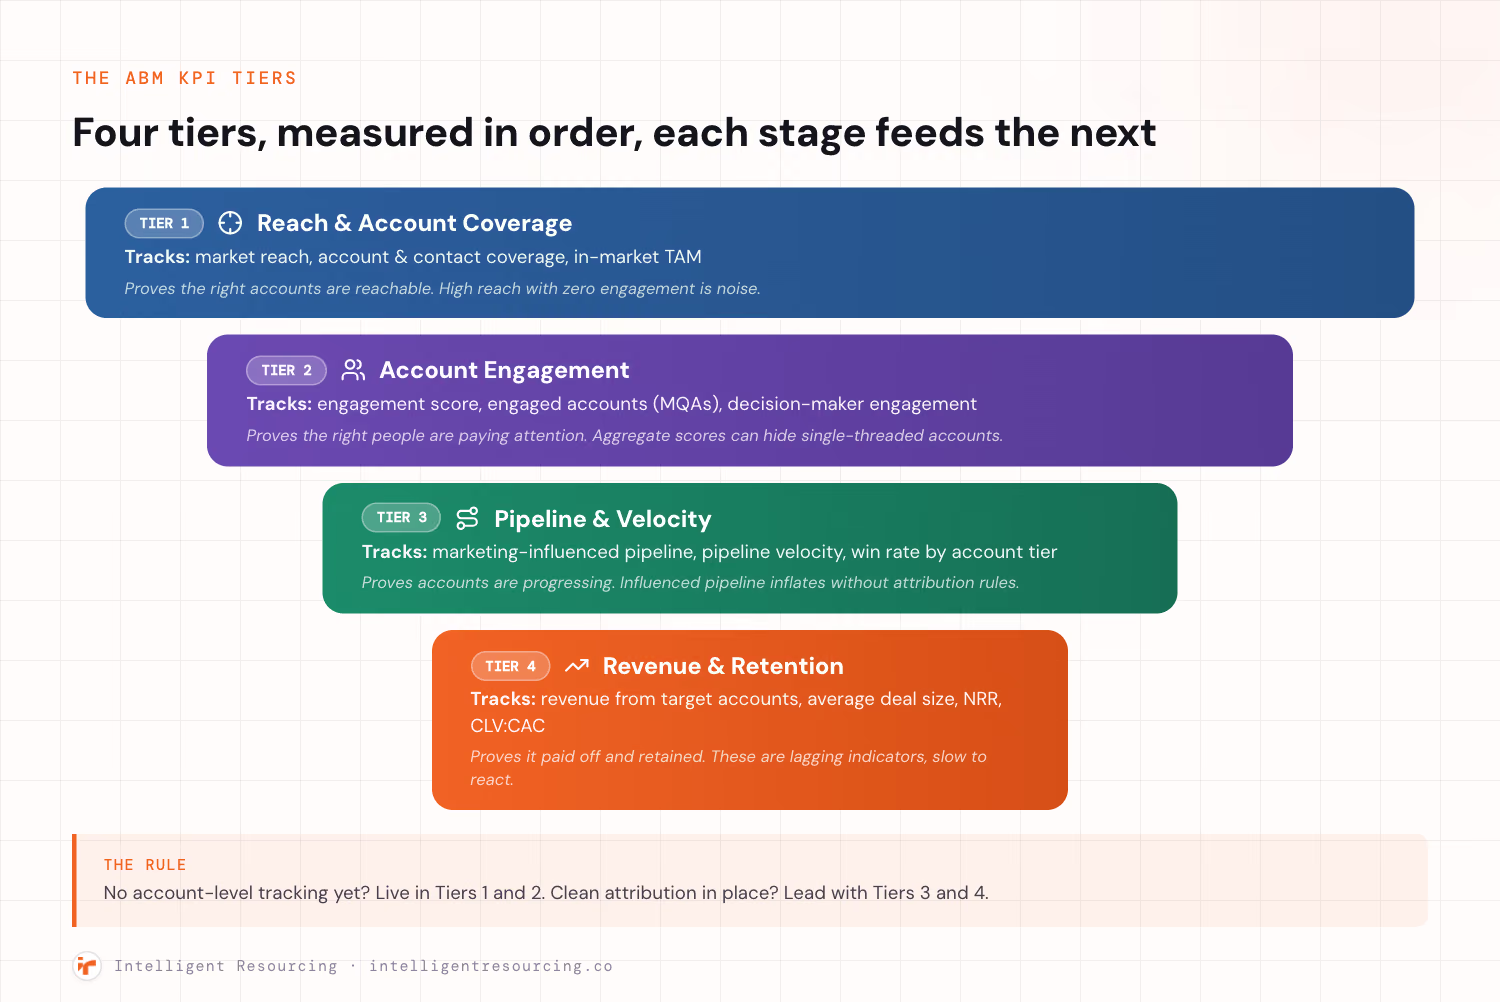
Strong ABM measurement stacks four tiers in order, and a KPI only earns a dashboard slot if it changes a decision. Read them as a chain: reach enables engagement, engagement feeds pipeline, pipeline converts to revenue and retention. That matches how ABM KPIs sort into reach and engagement, pipeline and conversion, then retention and growth, because high reach with no engagement is just noise. The last tier carries most of the money, since retaining and growing an existing account costs a fraction of winning a new one: Releva.ai's 2026 analysis puts the real acquisition-to-retention cost ratio at 5 to 25 times, depending on industry, with B2B acquisition costs now averaging around $536 per customer, so retention deserves equal billing with new-logo pipeline.
Tier 1: Reach and Account Coverage
This tier answers whether you are in front of the right accounts at all. Track market reach, account and contact coverage, and in-market target accounts, so you know how much of your total addressable market (TAM) is worth pursuing.
Tier 2: Account Engagement
This tier answers whether the right people are paying attention and whether it is trending up. Track account engagement score, engaged accounts (MQAs), and decision-maker and content engagement, so you see depth across the buying group, not one contact. A rising score across three or more stakeholders predicts pipeline.
Tier 3: Pipeline and Velocity
This tier answers whether target accounts are progressing. Track marketing-influenced pipeline, pipeline velocity, stage conversion and win rate by account tier, so you separate accounts that are moving from accounts that are merely busy.
Tier 4: Revenue and Retention
This tier answers whether it paid off and stuck. Track revenue from target accounts, average deal size, net revenue retention (NRR) and the CLV:CAC ratio, so growth inside existing accounts is measured as rigorously as new logos. They are lagging indicators that confirm the motion rather than steer it.
| Tier | Example KPIs | What it proves | When it can mislead |
|---|---|---|---|
| 1. Reach & coverage | Market reach, account coverage, TAM in-market | Right accounts are reachable | High reach with zero engagement is noise |
| 2. Engagement | Account engagement score, MQAs, decision-maker engagement | Right people are paying attention | Aggregate scores can hide single-threaded accounts |
| 3. Pipeline & velocity | Influenced pipeline, pipeline velocity, win rate by tier | Accounts are progressing | Influenced pipeline inflates without attribution rules |
| 4. Revenue & retention | Revenue from target accounts, avg deal size, NRR, CLV:CAC | It paid off and retained | Lagging indicators; slow to react |
Your reporting maturity decides how far up the stack you can go: without account-level tracking, live in Tiers 1 and 2; with clean attribution, lead with Tiers 3 and 4. Headline only the tier you can defend.
Vanity Metrics to Ignore in ABM
The fastest way to improve ABM reporting is to delete the metrics that move without changing a single deal. Vanity metrics share one trait: they are not filtered to your target accounts, so they reward the volume the ABM motion was designed to avoid. That is why vanity, activity and cost metrics should not be where ABM teams focus; they inflate with spend and reach while saying nothing about whether your chosen accounts are engaging. The fix is prescriptive: every metric you cut maps to an account-level replacement.
The Five Vanity Metrics to Cut
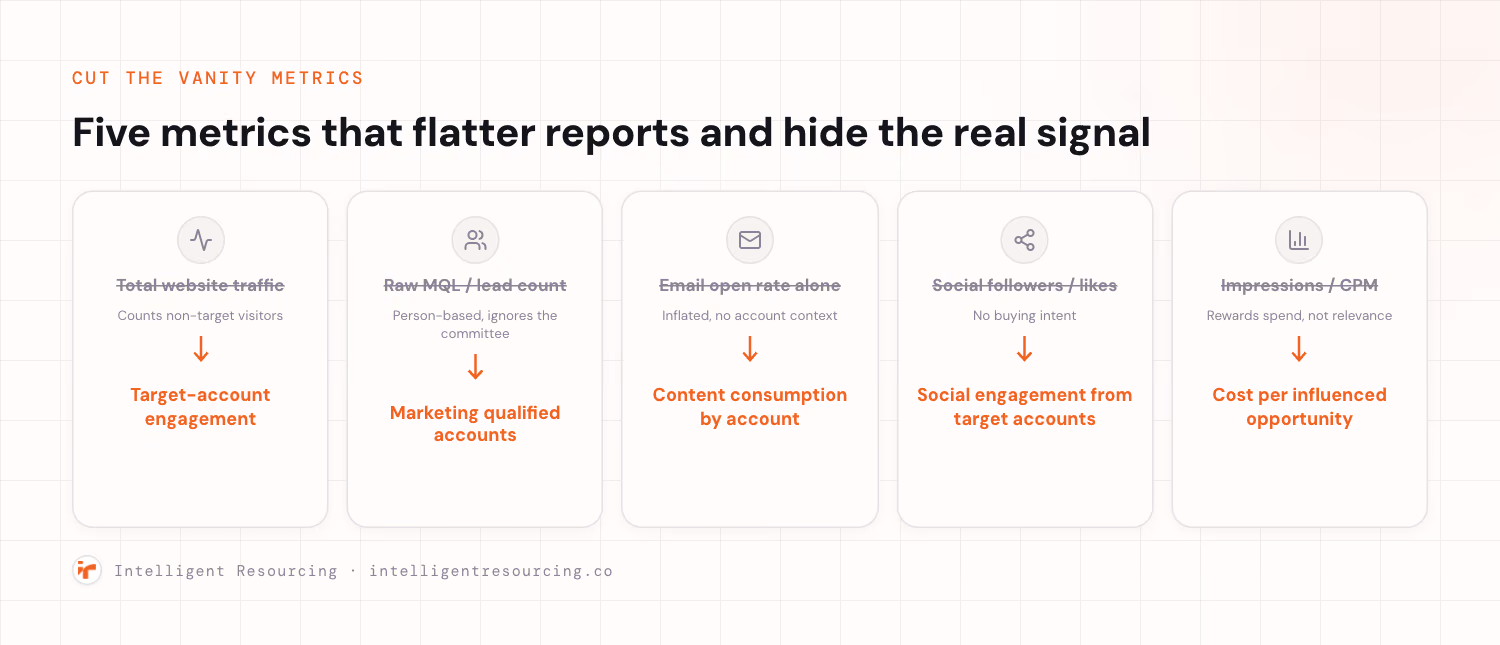
| Vanity metric | Why it misleads in ABM | Measure this instead |
|---|---|---|
| Total website traffic | Counts non-target visitors | Target-account engagement |
| Raw MQL / lead count | Person-based, ignores committee | Marketing qualified accounts (MQAs) |
| Email open rate alone | Inflated, no account context | Content consumption by account |
| Social followers / likes | No buying intent | Social engagement from target accounts |
| Impressions / CPM | Rewards spend, not relevance | Cost per influenced opportunity |
Every replacement adds an account filter the vanity metric lacks, so it only moves when a target account acts.
What to Measure Instead
The test for any KPI: would a change in this number change what we do next week? If total traffic doubles but no target account engages, you do nothing, so it fails the test and does not belong on the dashboard.
How to Measure ABM Success Against 2026 Standards
2026-grade ABM measurement means account-level baselines, a single agreed definition of a qualified account, and attribution that survives a finance review. Set the baseline first, then measure lift and attribute pipeline with rules you can defend. The payoff is large: Demandbase's analysis cites TOPO's benchmark that account-based opportunities closed at 53% against 19% for demand generation, and 42DM reports that teams running AI-assisted ABM see a 59% lift in pipeline productivity. Engagement scoring sits at the centre of it, so get your buyer intent signals right before you build dashboards.
Set Account-Level Baselines Before Benchmarks
A benchmark is meaningless without your own starting line, so capture current engagement, coverage and velocity for target accounts first, then measure lift against it. An industry benchmark tells you nothing about whether you improved.
Use MQAs, Not MQLs
Switch the qualification unit from the marketing qualified lead to the marketing qualified account. An MQA aggregates engagement across every known contact, so it reflects the whole buying group rather than one form-fill, and predicts buying better than individual lead scores.
Reporting Cadence and Attribution
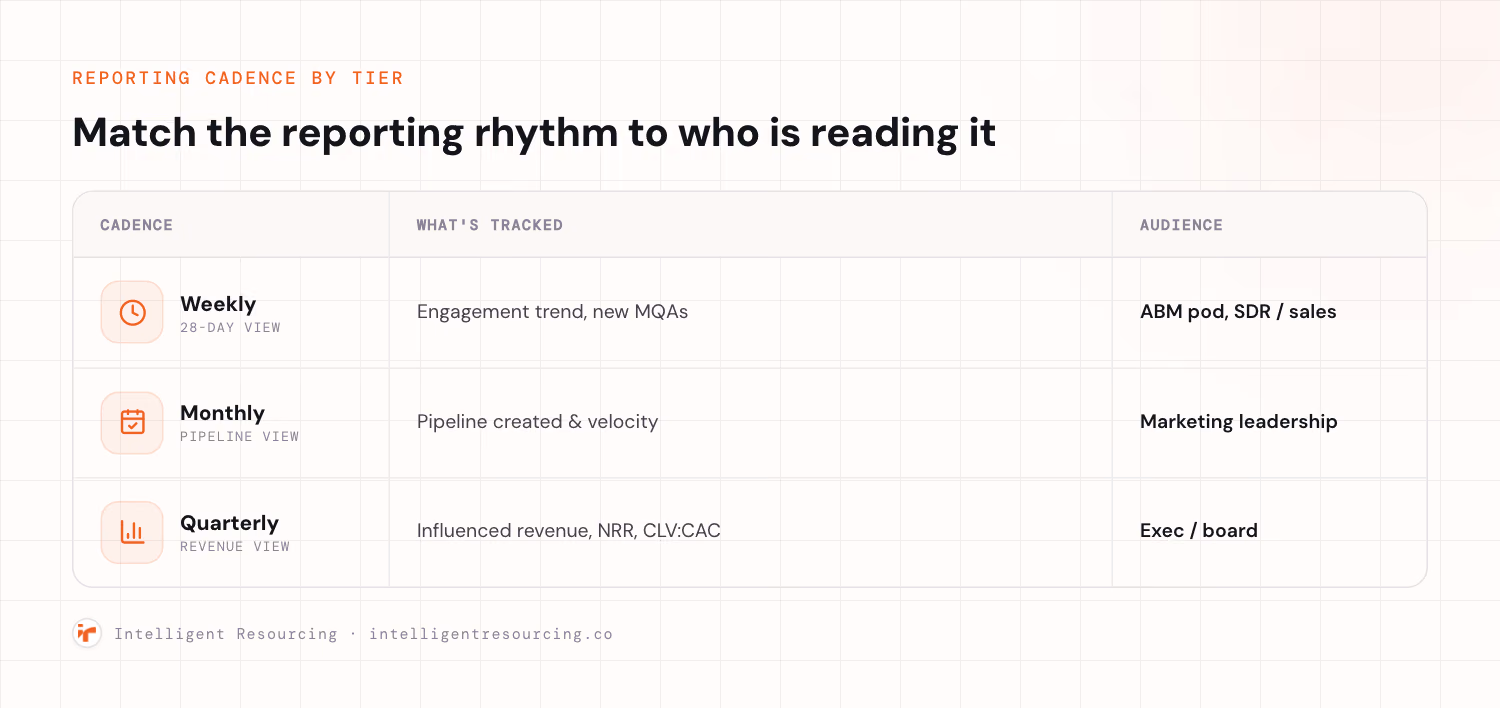
Match each metric to a review rhythm, then agree the attribution rules before anyone questions the pipeline number.
| Cadence | What to review | Primary audience |
|---|---|---|
| Weekly / 28-day | Engagement trend, new MQAs | ABM pod, SDR/sales |
| Monthly | Pipeline created & velocity | Marketing leadership |
| Quarterly | Influenced revenue, NRR, CLV:CAC | Exec / board |
Match review depth to sales-cycle length: a six-month cycle does not need weekly revenue reviews, but it does need weekly engagement reads to catch accounts going cold.
Which ABM KPIs to Prioritise for Your Situation
The right starting KPIs depend on your ABM maturity and team setup, so route by your situation rather than copying someone else's dashboard.
- If you are launching ABM next quarter with no account-level tracking, start with Tier 1 reach and Tier 2 engagement only, and ignore attribution until you have data.
- If sales and marketing report from different systems, fix lead-to-account matching and agree one MQA definition before building any KPI dashboard.
- If leadership is questioning ABM budget, lead the report with marketing-influenced pipeline and win rate by account tier.
- If your target list is under 50 accounts, track account-by-account engagement depth rather than aggregate conversion rates.
- If your priority is expanding existing accounts, weight NRR, upsell and product adoption above new-logo metrics.
Put Your ABM Measurement Framework to Work
The single principle worth keeping is this: the KPIs worth reporting are the ones filtered to your target accounts and tied to a decision. Everything else is activity dressed up as progress. You do not need to rebuild the whole dashboard this quarter; pick one tier to fix, usually engagement or influenced pipeline, and get it clean before you move on.
Every quarter spent reporting vanity metrics is a quarter leadership cannot tell whether ABM is working, so the cost of waiting compounds. To pressure-test your ABM scorecard, book a call before your next board review.
GTM Engineering
Intelligent Resourcing builds account-level measurement frameworks for signal-led ABM teams, from MQA definitions to pipeline attribution, so you can report the tier that actually proves the motion is working.
FAQs
What Are the Most Important ABM KPIs to Track in 2026?
Track the four-tier essentials: engaged accounts (MQAs) and account engagement score for attention, marketing-influenced pipeline and pipeline velocity for progression, and net revenue retention for whether the win stuck. The list is deliberately account-level, because ABM is decided by buying groups, not individual leads.
Which ABM Metrics Should I Ignore as Vanity Metrics?
Ignore total website traffic, raw lead or MQL counts, email open rate on its own, social followers and impressions or CPM. None are filtered to your target accounts. Replace them with target-account engagement, MQAs, content consumption by account, social engagement from target accounts, and cost per influenced opportunity.
How Is ABM Measurement Different From Traditional Marketing KPIs?
The unit changes. Traditional marketing KPIs count individuals, form-fills, sessions and opens, while ABM measures the account and its buying group. ABM is also full-funnel rather than top-of-funnel. Because most B2B purchases involve three or more stakeholders, a single-contact metric structurally under-reports account interest.
What Is a Marketing Qualified Account (MQA)?
A marketing qualified account is an account, or buying centre, whose aggregate engagement across its contacts crosses a threshold that merits sales outreach. It differs from an MQL, which scores one individual. Five mid-intent contacts can qualify an account that no single lead score would flag.
Should I Track Leads or Accounts to Measure ABM Success?
Accounts. Account-level engagement predicts buying better than individual lead scores because purchases are made by committees, not single contacts. Keep leads as a secondary diagnostic to see who inside an account is engaging and who is still dark, but report success at the account level.
How Often Should I Review My ABM KPIs?
Review engagement trends and new MQAs weekly or on a 28-day window, pipeline created and velocity monthly, and influence revenue, NRR and CLV:CAC quarterly. Then match review depth to sales-cycle length.